


FRIDAY PM DRIFT

Worth waiting for… There is a specific timing window on Friday, whose qualifying exit can signal either extending or reversing substantially before the close.
BIAS WINDOWS

Based on the principles that are the core of my methodology. Specific price action at the open can forecast the morning price bias: targets, and price extremes that should hold if tested. A similar setup forms coming out of the noon hour.
PERSISTENT-RSI

The RSIs indicator becoming persistently overbought or oversold is often assumed to be signaling an impending price reversal. This may be correct, eventually, but certain other conditions make the RSI measurement signal the prevailing trend remains very much intact.
PROXY GAP
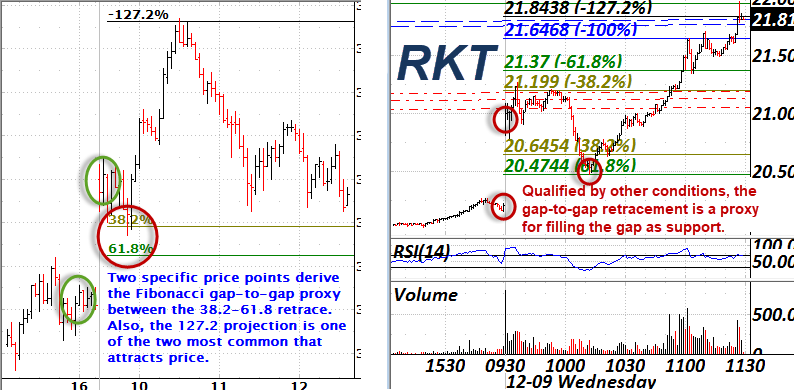
Gaps back to a session’s closing price can be influential without being filled. A psychological proxy forms at the 38.2% and 61.8% Fibonacci retracement between two specific price points representing the gap. RSI behavior accompanying a test can predict whether the proxy’s test will be reversed, or give way. Other properties of the calculation are also very predictive. This is a very frequently seen setup.